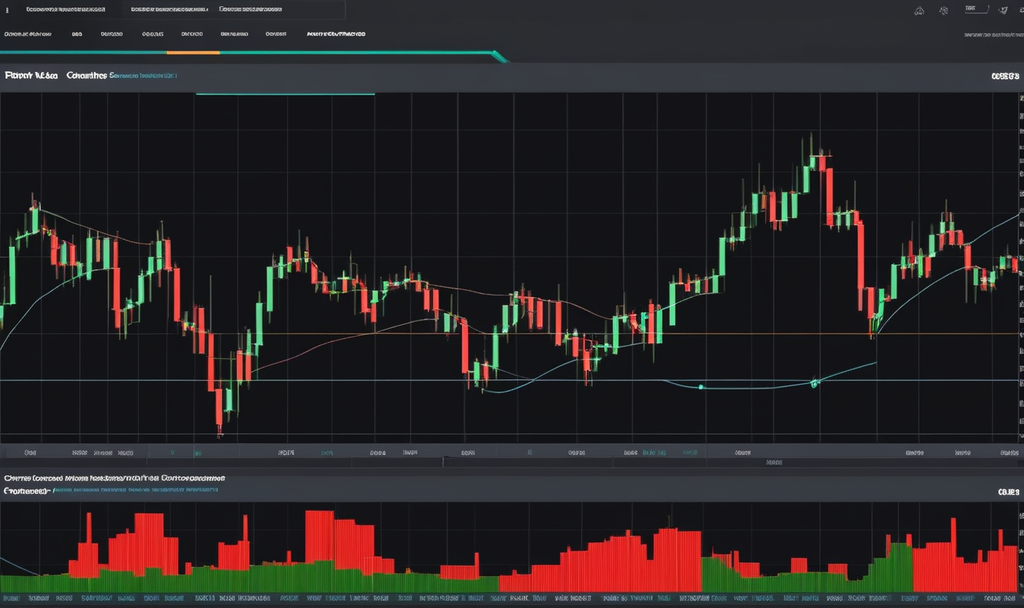
In the fast-paced world of cryptocurrency trading, understanding and interpreting price movements is crucial. Traders employ various technical analysis tools to make informed decisions and increase their chances of success. One such tool gaining popularity is the Renko chart. Renko charts offer a unique perspective on price movements, providing a simplified and effective way to analyze trends. In this blog post, we will delve into the world of Renko charts, exploring their characteristics, advantages, and how they can be utilized in the dynamic realm of crypto trading.
What Are Renko Charts?
Renko charts originated in Japan and have been used for centuries to analyze price movements. Unlike traditional candlestick or bar charts, Renko charts focus solely on price changes, filtering out the noise and presenting a clearer picture of trends. The name “Renko” is derived from the Japanese word “renga,” meaning bricks. This is fitting, as Renko charts consist of bricks or blocks that represent a predefined price movement.
The Anatomy of a Renko Chart
Renko charts consist of a series of bricks, each representing a specific price movement. These bricks are typically color-coded, with different colors indicating upward and downward price trends. The size of each brick is determined by a parameter set by the trader, such as a fixed price range or a percentage change in price.
Unlike traditional charts, Renko charts do not have a time axis. Instead, new bricks are added only when the price moves beyond the predefined range. This characteristic eliminates the influence of time intervals, providing a more accurate reflection of market trends.
Advantages of Renko Charts in Crypto Trading
- Noise Reduction: Renko charts filter out minor price fluctuations, helping traders focus on significant trends. This noise reduction is particularly beneficial in the volatile world of cryptocurrency, where prices can experience rapid and unpredictable changes.
- Trend Identification: Renko charts make it easier to identify trends, as each brick represents a specific price movement. Traders can quickly spot the direction of the trend without being distracted by short-term market fluctuations.
- Simplicity: Renko charts offer a straightforward visual representation of price movements. This simplicity makes them especially appealing to both novice and experienced traders who prefer a clean and uncluttered chart.
How to Use Renko Charts in Crypto Trading
- Setting Brick Size: The first step in using Renko charts is to determine the appropriate brick size. This is a crucial decision that depends on the trader’s preferences and the specific cryptocurrency being analyzed. A smaller brick size captures more price movements, while a larger size smoothens the chart and focuses on major trends.
- Identifying Trends: Once the brick size is set, traders can easily identify trends based on the color and direction of the bricks. An upward trend is represented by green bricks, while red bricks indicate a downward trend. Consistent colors indicate a strong trend, while alternating colors may signal a potential reversal.
- Utilizing Support and Resistance: Renko charts can be combined with traditional support and resistance analysis to enhance trading strategies. Identifying key support and resistance levels on Renko charts can provide valuable insights into potential entry and exit points.
Limitations of Renko Charts
While Renko charts offer several advantages, it’s essential to be aware of their limitations. One significant drawback is the delayed signal in trend changes. Since a new brick is only formed after a price movement exceeds the predefined range, traders may experience a delayed response to rapidly changing market conditions.
If you have any question about this article, please contact us …
You can easily create a free cryptocurrency wallet with binance …
Conclusion: Enhancing Crypto Trading with Renko Charts
In the ever-evolving landscape of cryptocurrency trading, staying ahead of market trends is paramount. Renko charts provide traders with a powerful tool to simplify price movements, reduce noise, and identify trends more effectively. By incorporating Renko charts into their technical analysis toolbox, crypto traders can make more informed decisions and navigate the volatile market with greater confidence. Experimenting with different brick sizes and combining Renko charts with other technical indicators can further enhance their effectiveness in gaining a competitive edge in crypto trading.
In conclusion, Renko charts offer a refreshing perspective on crypto price movements, presenting a visually intuitive way to analyze trends. As with any trading tool, it’s crucial for traders to experiment, adapt, and integrate Renko charts into their broader strategy. The cryptocurrency market rewards those who are adept at leveraging diverse analytical tools, and Renko charts provide a valuable addition to the trader’s arsenal.

