Introduction:
In the dynamic world of cryptocurrency trading, success often hinges on a trader’s ability to make informed decisions based on rigorous analysis. While various approaches exist, one that stands out for its precision and objectivity is quantitative analysis. This blog post delves into the realm of quantitative analysis techniques in crypto trading, exploring its significance, key methodologies, and how traders can leverage data-driven insights for more profitable outcomes.
Understanding Quantitative Analysis:
Quantitative analysis involves the use of mathematical models and statistical tools to assess market trends, identify patterns, and make predictions. Unlike qualitative analysis, which relies on subjective judgments, quantitative analysis brings a level of objectivity to the trading process. Traders utilizing quantitative techniques analyze historical data and employ mathematical models to identify potential opportunities and manage risks effectively.
The Significance of Quantitative Analysis in Crypto Trading:
In the volatile world of cryptocurrencies, where prices can experience rapid and unpredictable fluctuations, having a systematic approach to decision-making becomes crucial. Quantitative analysis provides traders with a structured framework to evaluate market conditions, enabling them to make more informed and data-driven decisions.
Key Quantitative Analysis Techniques:
- Moving Averages:
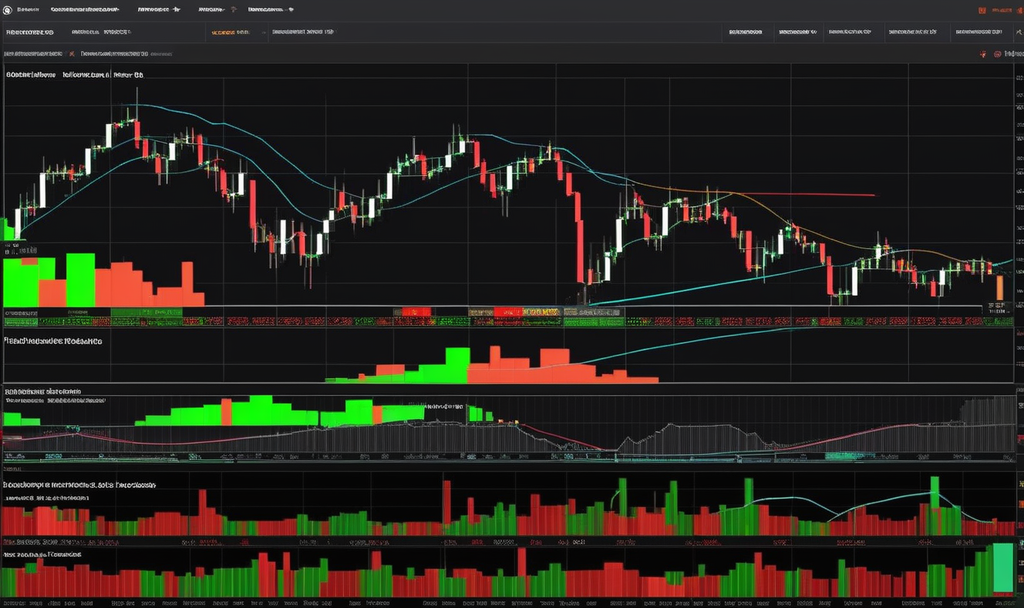
Moving averages are a fundamental tool in quantitative analysis, helping traders identify trends and potential reversal points. By calculating the average price over a specific time period, moving averages smooth out fluctuations and provide a clearer picture of the overall market direction.
- Bollinger Bands:
Bollinger Bands offer a dynamic way to assess price volatility and potential trend reversals. These bands consist of a simple moving average and two standard deviation lines, creating a visual representation of price volatility. Traders often use Bollinger Bands to identify overbought or oversold conditions in the market.
- Relative Strength Index (RSI):
The Relative Strength Index is a momentum oscillator that measures the speed and change of price movements. Traders use RSI to identify potential overbought or oversold conditions, helping them make more strategic entry and exit decisions.
- Fibonacci Retracement:
Fibonacci retracement is a technical analysis tool that helps traders identify potential levels of support and resistance. By plotting key Fibonacci levels on a price chart, traders can anticipate where price retracements may occur, aiding in more accurate entry and exit points.
Implementing Quantitative Analysis in Trading Strategies:
Traders can integrate quantitative analysis techniques into their trading strategies by combining various indicators and models. A well-rounded approach may involve using moving averages to identify trends, Bollinger Bands for volatility assessment, RSI for momentum confirmation, and Fibonacci retracement for price level predictions.
Quantitative Analysis in Action:
Let’s consider a hypothetical scenario to illustrate the practical application of quantitative_analysis in crypto trading. Suppose a trader is analyzing the price movement of a particular cryptocurrency using a combination of moving averages and RSI.
The trader observes a crossover of the short-term moving average above the long-term moving average, signaling a potential uptrend. To confirm this, the trader checks the RSI, which is below 30, indicating that the cryptocurrency is currently oversold. This alignment of signals suggests a potential buying opportunity.
Risk Management in Quantitative Analysis:
While quantitative_analysis provides valuable insights, effective risk management is equally crucial. Traders should set stop-loss orders, diversify their portfolios, and carefully consider position sizing based on their risk tolerance. Additionally, regular review and adjustment of trading strategies in response to changing market conditions are vital for long-term success.
Overcoming Challenges in Quantitative Analysis:
Quantitative analysis is not without its challenges, and traders must be aware of potential pitfalls. One common challenge is overfitting, where a model is too closely tailored to historical data, leading to poor performance in real-time markets. To address this, traders can use out-of-sample testing and regularly update their models to adapt to evolving market dynamics.
If you have any question about this article, please contact us …
You can easily create a free cryptocurrency wallet with binance …
Conclusion:
In the ever-evolving landscape of cryptocurrency trading, quantitative_analysis techniques provide a systematic and objective approach to decision-making. By leveraging tools such as moving averages, Bollinger Bands, RSI, and Fibonacci retracement, traders can gain valuable insights into market trends, identify potential opportunities, and manage risks effectively.
As with any trading approach, successful implementation requires a combination of technical expertise, strategic thinking, and disciplined risk management. By integrating quantitative_analysis into their trading strategies, crypto traders can navigate the complexities of the market with greater confidence and increase their chances of achieving long-term profitability.

