Introduction:
Cryptocurrency trading is a dynamic and ever-evolving landscape where investors seek to decipher market trends and make informed decisions. One of the crucial skills in this realm is the ability to interpret support and resistance levels on crypto charts. In this comprehensive guide, we will delve into the nuances of understanding and leveraging these key indicators, shedding light on their significance and how traders can navigate the crypto market effectively.
Understanding the Basics:
To begin our journey into interpret support and resistance in crypto charts, it’s essential to grasp the fundamental concepts behind these terms. Support and resistance are critical price levels that act as barriers in the market, influencing the direction of an asset’s price movement. Support represents the level at which a crypto’s price tends to stop falling, while resistance signifies the point at which it struggles to surpass a particular price ceiling.
Identifying Support and Resistance:
Traders often rely on various methods to identify support and resistance levels on crypto charts. The most common approach involves analyzing historical price data and identifying areas where the price has consistently bounced back or faced obstacles. These levels are not arbitrary but reflect the collective decisions of market participants, making them potent indicators of future price movements.
Visualizing Support and Resistance:
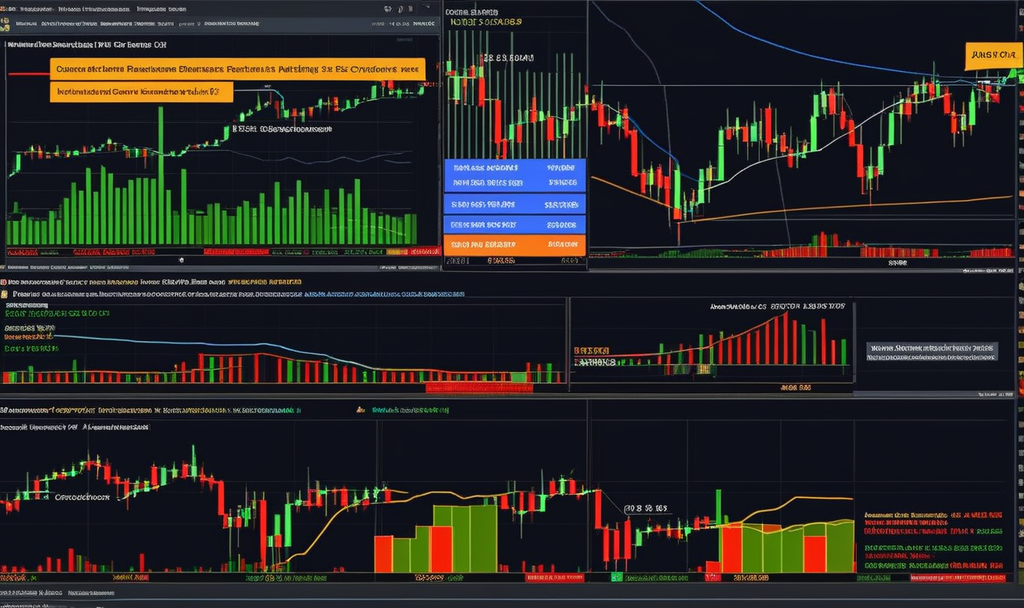
Charts are indispensable tools for visualizing support and resistance levels. Candlestick charts, in particular, provide a comprehensive view of price action, enabling traders to identify key levels with greater precision. As you embark on interpreting crypto charts, pay close attention to areas where candlesticks form patterns such as double tops, double bottoms, or head and shoulders – as these can signal potential support or resistance zones.
The Role of Volume:
Volume is another crucial factor to consider when interpreting support and resistance in crypto charts. High trading volumes at specific price levels indicate increased market activity, reinforcing the significance of those levels. Traders often look for confluence – a convergence of support or resistance levels with high trading volumes – as it enhances the reliability of these indicators.
Dynamic Nature of Support and Resistance:
It’s imperative to recognize that support and resistance levels are not static. They evolve over time based on market dynamics and changing investor sentiments. As a savvy trader, adapting to these changes is key to staying ahead of the curve. Regularly updating your analysis and reassessing potential support and resistance zones will help you make more informed decisions in the fast-paced world of cryptocurrency trading.
Utilizing Trendlines and Moving Averages:
Incorporating trendlines and moving averages into your analysis can enhance your ability to interpret support and resistance in crypto charts. Trendlines help identify the direction of the prevailing trend and potential areas of support or resistance. Moving averages, on the other hand, smooth out price data over a specified period, providing a clearer picture of the overall trend and potential reversal points.
The Psychological Aspect:
Beyond the technical aspects, understanding the psychological underpinnings of support and resistance is crucial. Support and resistance levels are, in essence, reflections of market psychology. Support levels often indicate a psychological barrier where buyers see value and are willing to enter the market, while resistance levels signify a point where sellers perceive the price as high, prompting them to offload their assets.
Risk Management and Stop Loss Orders:
Interpreting support and resistance levels is not just about predicting price movements; it’s also about managing risks effectively. Implementing stop-loss orders at or near these key levels can safeguard your investments by limiting potential losses. Traders should establish clear risk-reward ratios and adjust their positions based on the support and resistance levels identified in their analysis.
Common Pitfalls to Avoid:
As with any analytical approach, there are common pitfalls that traders should be mindful of when interpreting support and resistance in crypto charts. One such pitfall is overreliance on historical data without considering the current market context. Market conditions change, and what worked in the past may not necessarily be applicable in the present.
Another common mistake is neglecting the broader economic and geopolitical factors that can influence cryptocurrency prices. While technical analysis is valuable, a holistic approach that incorporates fundamental analysis and market sentiment is essential for a well-rounded interpretation of support and resistance levels.
If you have any question about this article, please contact us …
You can easily create a free cryptocurrency wallet with binance …
Conclusion:
In conclusion, mastering the art of interpreting support and resistance in crypto charts is a skill that can significantly enhance your trading prowess. By understanding the underlying principles, utilizing visual aids, and incorporating additional indicators, you can navigate the volatile crypto market with greater confidence. Remember, support and resistance levels are not rigid; they evolve, requiring continuous analysis and adaptation. As you embark on your crypto trading journey, consider these insights as valuable tools in your arsenal, empowering you to make well-informed decisions in the ever-changing landscape of cryptocurrency.

