Introduction
Understanding how to draw trendlines is a fundamental skill for anyone venturing into the world of cryptocurrency trading. Trendlines help identify key support and resistance levels, aiding traders in making informed decisions. In this step-by-step guide, we will explore the art of drawing trendlines on crypto charts, empowering you to navigate the volatile markets with confidence.
Selecting the Right Timeframe
Before diving into the intricacies of drawing trendlines, it’s crucial to choose an appropriate timeframe for your analysis. Whether you’re a day trader or a long-term investor, adjusting your chart to reflect your trading horizon is the first step in the process.
Identifying Highs and Lows
To draw an effective trendline, you need to identify significant highs and lows in the price movement. These points serve as the foundation for creating trendlines that accurately represent market trends.
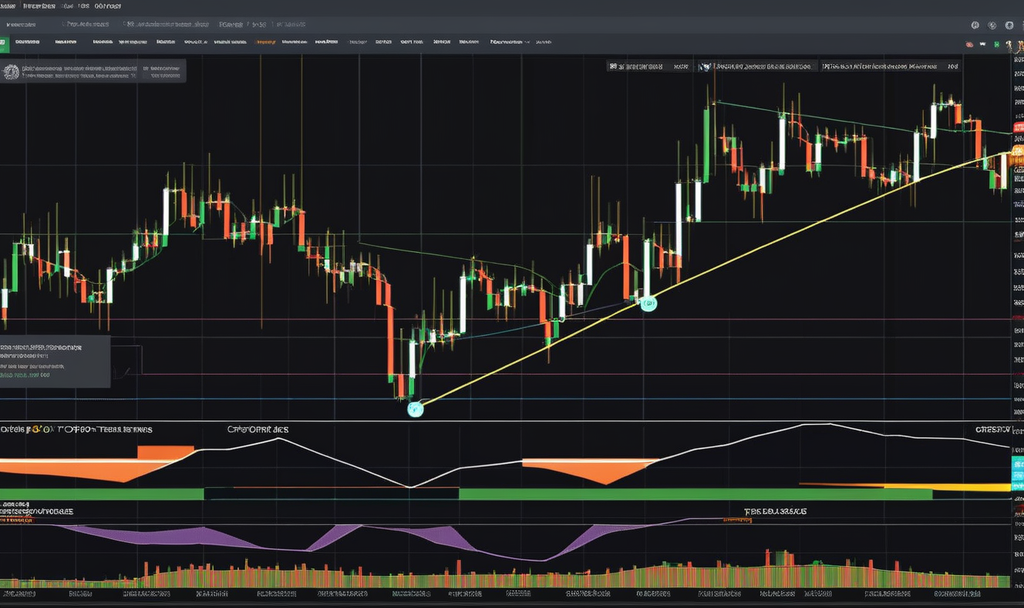
Drawing an Uptrend Line
In an uptrend, connect the higher lows with a straight line. This line represents the ascending support level, indicating a positive trend in the market. Remember to touch as many low points as possible without violating the overall trend.
Drawing a Downtrend Line
Conversely, in a downtrend, connect the lower highs to form a descending resistance line. This line represents the downward pressure on the market. Like the uptrend line, the downtrend line should touch as many high points as possible without deviating from the overall trend.
Utilizing Candlestick Patterns for Confirmation
To enhance the reliability of your trendlines, consider incorporating candlestick patterns for confirmation. Bullish or bearish candlestick formations at key points along the trendline can provide additional insights into potential trend reversals or continuations.
Understanding Trendline Channels
Trendline channels involve drawing parallel lines alongside the original trendline to create a channel that encapsulates price movements. This technique adds depth to your analysis by highlighting potential trading ranges within the overall trend.
Applying Trendlines to Support and Resistance Zones
Trendlines are not only valuable for identifying trends but also for pinpointing crucial support and resistance zones. By extending trendlines horizontally, you can identify areas where price fluctuations are likely to encounter barriers.
Adjusting Trendlines with Price Volatility
Cryptocurrency markets are known for their volatility, and as a trader, it’s essential to adapt your trendlines accordingly. Periodically review and adjust your trendlines to accommodate the changing market dynamics.
Using Trendlines in Conjunction with Other Indicators
While trendlines are powerful tools on their own, combining them with other technical indicators can amplify their effectiveness. Consider incorporating moving averages, RSI, or MACD to strengthen your overall market analysis.
Drawing Trendlines on Multiple Timeframes
To gain a comprehensive understanding of market trends, draw trendlines on multiple timeframes. This approach allows you to identify both short-term and long-term trends, providing a more holistic view of market dynamics.
If you have any question about this article, please contact us …
You can easily create a free cryptocurrency wallet with binance …
Conclusion
Mastering the art of drawing trendlines is a crucial skill for any cryptocurrency trader. By following this step-by-step guide, you can confidently analyze charts, identify trends, and make informed decisions in the ever-evolving world of crypto trading. Remember, practice and adaptability are key to honing your trendline-drawing skills and navigating the complexities of the cryptocurrency market.